
(PRO) Commission Graph (Line Graphs)
Updated March 15, 2021
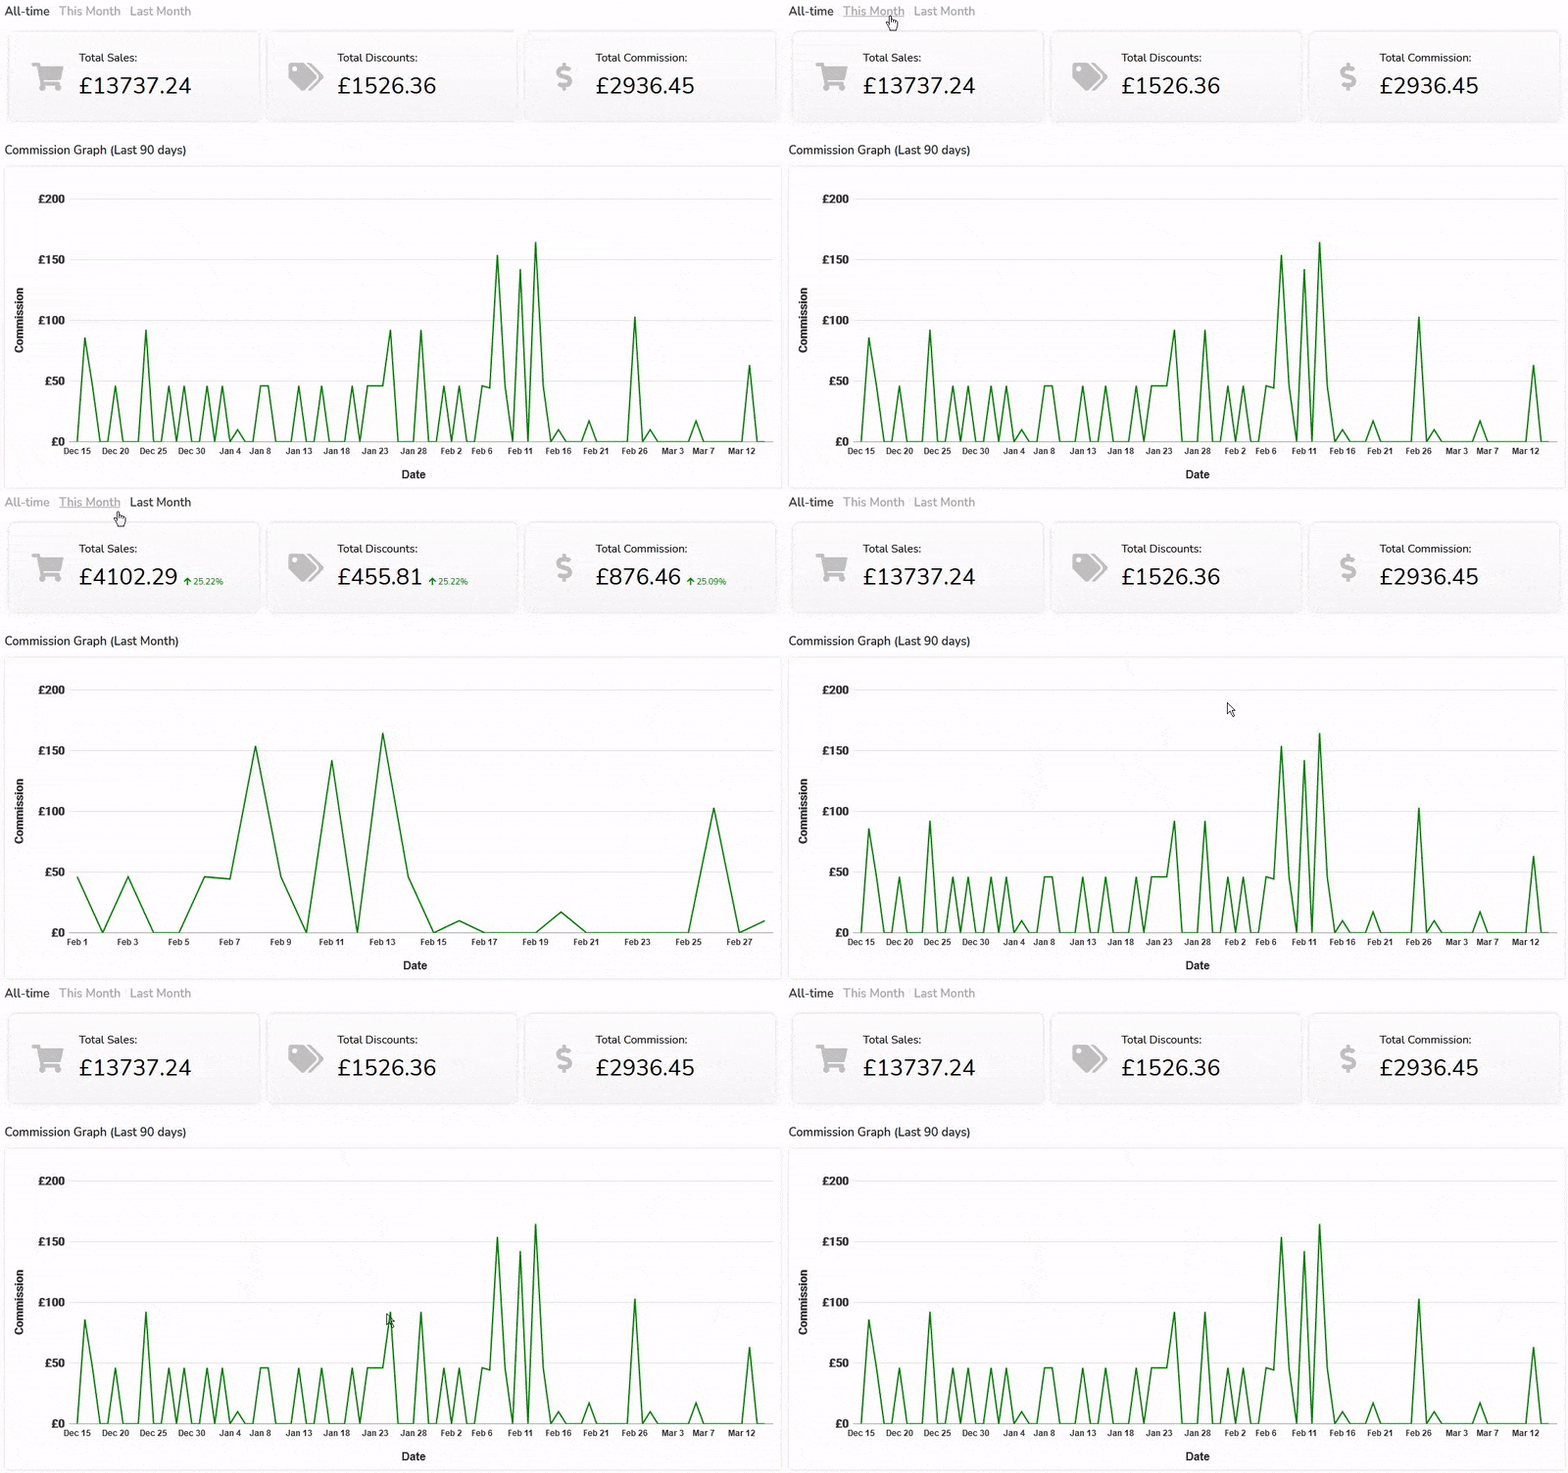
The “Commission Graph” is a line graph shown on the affiliate dashboard, under the “Statistics” tab, that plots the commission earned by the affiliate for every day in the selected period.
Affiliates can toggle the graph between the last 90 days, last 30 days and last 7 days. Alternatively, you can change the toggles to show “last 90 days, this month, and last month” instead. This is controlled by the “What toggles should be shown for statistics and line graphs?” option in the “General” settings tab (either “All-time / Last 30 Days / Last 7 Days” or “All-time / This Month / Last Month”), which also applies to the statistics section above the graph.
If you don’t want to show the graph, it can be turned off with the “Show Commission Graphs” toggle in the “General” settings tab. You can also change where it appears on the dashboard by re-ordering the “Commission Graph” section in the dashboard sections settings.
See also: Affiliate Dashboard Statistics.